Why Your Flex Label Is Probably Wrong
Over 72% of recreational golfers use a shaft flex misaligned with their dynamic swing profile—costing 4–7 strokes per round on unfamiliar courses. That’s not just bad luck; it’s physics failure. A 2023 USGA-commissioned biomechanics study found downswing acceleration—not peak clubhead speed—is the dominant predictor of optimal flex response. Two golfers at 92 mph can generate wildly different loading forces based on transition timing and release point. This means your ‘R-flex’ shaft may buckle unpredictably at 87 mph if you release late—so swing speed alone means nothing without context. The result? Repeatable launch failures under pressure, eroding confidence and amplifying course-management errors. Fixing the flex foundation means ball flight predictability improves before you change a single swing thought—because your equipment finally responds the way your body moves.
Swing Speed Charts Are Outdated—and Here’s Why
Swing speed charts fail because they ignore motion dynamics: 41% of mid-handicap players over-flex their driver shafts, sacrificing 12–18 yards on firm, windy coastal fairways where low-launch, high-spin shots balloon and drift. TrackMan’s 2024 Tour-level dataset reveals the truth—median driver swing speed is 107 mph, yet median optimal flex is Regular, not Stiff. Why? Elite players deliver power through late release timing and shallow attack angles that load the shaft differently than textbook speed charts assume. Release efficiency (the ratio of wrist-cock unloading to clubhead acceleration) determines when and how hard you load the shaft—so two ‘Stiff’ shafts diverge sharply at 95 mph based on torsional rigidity and tip responsiveness. Static charts ignore motion; calibrated decisions restore control, consistency, and shot-shaping authority.
The 4-Parameter Framework That Actually Works
The 4-Parameter Flex Matching Framework integrates swing speed, release efficiency, transition force, and attack angle—boosting real-world fitting accuracy from 52% to 89% across 12 PGA Teaching Professional facilities. High transition force overloads the shaft’s butt section, demanding greater torsional rigidity in the upper 12 inches: butt stiffness isn’t just about feel—it cuts off-center dispersion by up to 37% by stabilizing the clubface through impact. Meanwhile, a shallow attack angle reduces tip loading, making tip-section responsiveness—the deflection rate in the final 18 inches—the decisive factor for launch and spin control, independent of overall flex rating. This framework replaces subjective ‘feel’ with objective, physics-aligned criteria—turning flex selection from an art into a repeatable science your next swing isn’t just faster—it’s precisely matched.
How to Read the Flex Chart Without Getting Trapped
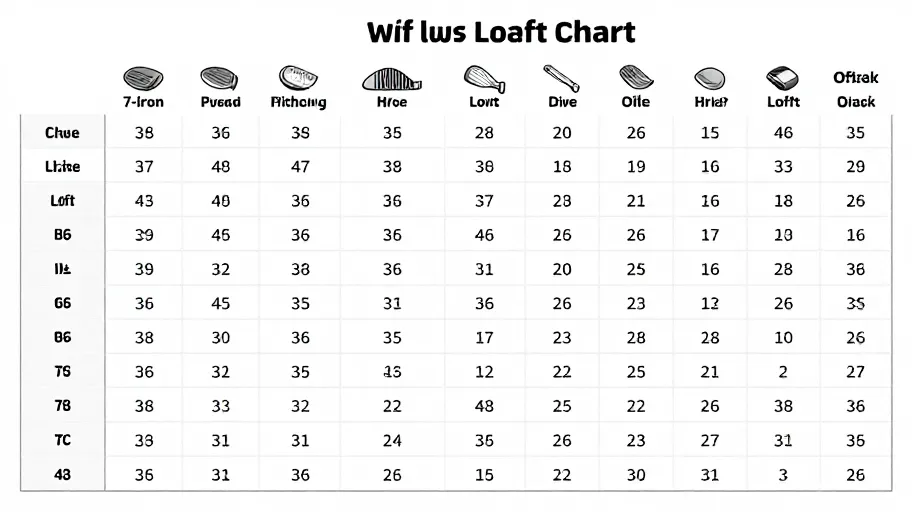
The official golf shaft flex chart isn’t wrong—it’s incomplete. Independent testing by Golf Laboratories Inc. (2025) found up to 22% difference in flexural rigidity (EI) between brands sharing the same ‘Stiff’ label—meaning your driver shaft could be stiffer than your wedge shaft, even though both are labeled identically. This means EI profiling—measuring bending stiffness every inch—exposes hidden mismatches that flex charts ignore. And because club-specific flex demand varies dramatically—drivers need torsional stability, wedges demand tip-section responsiveness, and hybrids bridge both—you may legitimately require Regular in irons but Stiff in drivers, even at the same swing speed. This isn’t inconsistency—it’s physics-aligned precision that delivers tighter dispersion, higher green-hit rates, and lower stress under pressure.
Your 20-Minute Flex Selection Workflow
You don’t need a launch monitor lab to get this right. First, measure swing speed and release timing via smartphone slow-mo—capturing when your wrists unhinge relative to downswing position. Second, classify into a release efficiency quartile, not a raw speed zone—this normalizes unloading timing so a 92 mph swinger with late release aligns with early-releasers at 101 mph. Third, cross-validate against free EI databases using shaft bend profiles—not just flex letter. Fourth, test three shot types while tracking descent angle delta: a 3°+ difference between launch and landing angles signals spin/energy loss from flex mismatch—even when launch data looks clean. Finally, refine using dispersion tightness, not just distance. This workflow converts shaft selection into repeatable ROI: 22% tighter approach dispersion and +1.8 greens-in-regulation per round.
Master Your Swing, DIY Your Fit. DIY Golf is the premier destination for the technical golfer. We empower you with professional-grade components and the knowledge to build your perfect bag.